
On this page
Hydrogen sulfide is one of the most common treatment challenges in Florida groundwater, and ozone is one of the most effective tools for removing it. The Sanford project shows both sides of that story: a pilot study in which ozone consistently drove sulfide to non-detect levels, and a later full-scale investigation showing that the same chemistry can form bromate when ozone exposure, mixing, sensor placement and plant flow are not optimally designed and controlled together. This paper distills the project record into practical guidance for anyone planning, designing, or operating an ozone system on sulfide-bearing groundwater.
Executive summary
Many Florida utilities draw from aquifers that deliver water with dissolved hydrogen sulfide (H2S), along with natural organic matter that reacts with chlorine to form regulated disinfection by-products. Conventional approaches such as aeration, chlorine oxidation, and packed towers each bring trade-offs in footprint, odor, chemical use, or by-product formation. Ozone oxidizes sulfide in seconds, needs no added chemicals in the water, and conditions organics for downstream biological carbon treatment. That combination makes ozone followed by granular activated carbon (GAC) an attractive treatment train for these sources.
The City of Sanford adopted exactly that approach at Auxiliary Water Treatment Plant 2. A September 2011 pilot study, supported by Pinnacle Ozone Solutions and reviewed with the City, CPH Engineers, and Reiss Engineering, produced clear results. Raw-water sulfide of 1.45 to 1.88 mg/L was reduced to 0.01 mg/L or less on all ten ozone-on sampling days. UV254 absorbance, an indicator of organic content, fell by an average of 52% at the 40% generator setting and 63% at the 50% setting. The project team set a preliminary design dose of 7 to 8 mg/L and added a contact basin so that residual ozone would decay before reaching the carbon.
In December 2015, several years into full-scale operation, the plant began reporting bromate above the 10 µg/L federal limit. A 2016 investigation by Guardian Manufacturing Research and Development Laboratory (GRDL) found that sulfide removal remained fully effective but that bromate of 13.2 µg/L was already present at the first ozone monitoring point. Bench tests on stored samples had understated bromate because the samples had lost their sulfide in transit. The plant was also operating at only 50 to 70% of design flow, which roughly doubled nominal contact time at the low end of the range.
Key lessons for ozone projects on sulfide-bearing groundwater
- Pilot with representative water and measure bromate from day one. Sulfide removal and bromate formation must be evaluated together, using samples that are spiked to sulfide concentrations similar to raw water levels.
- Design the injection and blending zone as a reactor. Bromate can form before the first conventional sample point, so sample access and mixing belong in the earliest part of the process.
- Account for the flow the plant will actually run. Turndown changes contact time and mixing; the operating envelope should be verified across the realistic flow range, not only at design flow.
- Optimize sensor type and location for bromate control. Source waters with relatively high bromide along with sulfide need precise control of the ozone injection process, in addition to fast sensor response times.
Why ozone for sulfide-bearing groundwater
Hydrogen sulfide gives water its characteristic rotten-egg odor at very low concentrations, corrodes metals, and exerts a large oxidant demand that competes with disinfection. Sulfide-bearing groundwater frequently also carries natural organic matter. When that water is chlorinated, the organics form trihalomethanes and haloacetic acids, both regulated under the Stage 2 Disinfectants and Disinfection By-products Rule.
Ozone addresses both problems. It reacts with sulfide extremely quickly; in the Sanford pilot, the project team noted that most of the reaction was complete in less than 5 seconds. Ozone also breaks down larger organic molecules into smaller, more biodegradable fragments. That makes it a natural partner for biologically active carbon, which can then remove much of that material before chlorination. [10] Because ozone is generated on site from oxygen, the treatment adds no residual chemical to the water and creates no sludge.
The trade-off is the potential formation of bromate. When source water contains bromide, ozone and the hydroxyl radicals it produces can oxidize bromide to bromate, a regulated by-product with a maximum contaminant level of 0.010 mg/L (10 µg/L). [7–9] Bromate formation depends on the ozone exposure the water experiences over time, not just the residual measured at a single point. It is also significantly affected by the pH, temperature, organic content, and mixing. A well-designed system delivers enough ozone to satisfy the sulfide demand quickly, then avoids holding excess ozone in contact with bromide-bearing water longer than necessary.
The Sanford project
The City of Sanford, Florida, investigated how to improve hydrogen sulfide removal and reduce disinfection by-products at Auxiliary Water Treatment Plant 2, whose well supply contains both sulfide and organic carbon. CPH Engineers led preliminary design, with Reiss Engineering participating in the review. Pinnacle Ozone Solutions provided ozone process support, including ozone decay testing, and hosted the October 2011 project review at its fabrication facility. The selected concept used ozone for H2S removal and GAC for organic carbon removal (as assimilable organic carbon, AOC), sized in preliminary design for a nominal capacity of about 5 MGD. [5] The ozone contact basin was ultimately designed for 4.6 MGD. [6]
City staff operated the pilot over three weeks in September 2011. The pilot train passed water through ozone injection, a pipe reactor, and an equalization tank with a nominal 15-minute detention time before reaching the GAC vessels. Samples were taken at the raw water, ozone effluent, pipe effluent, tank, and carbon effluent points. The first week ran with ozone off to establish a baseline. The second and third weeks ran the ozone generator at 40% and then 50% output. [1–4]
Pilot results: ozone reliably removed sulfide
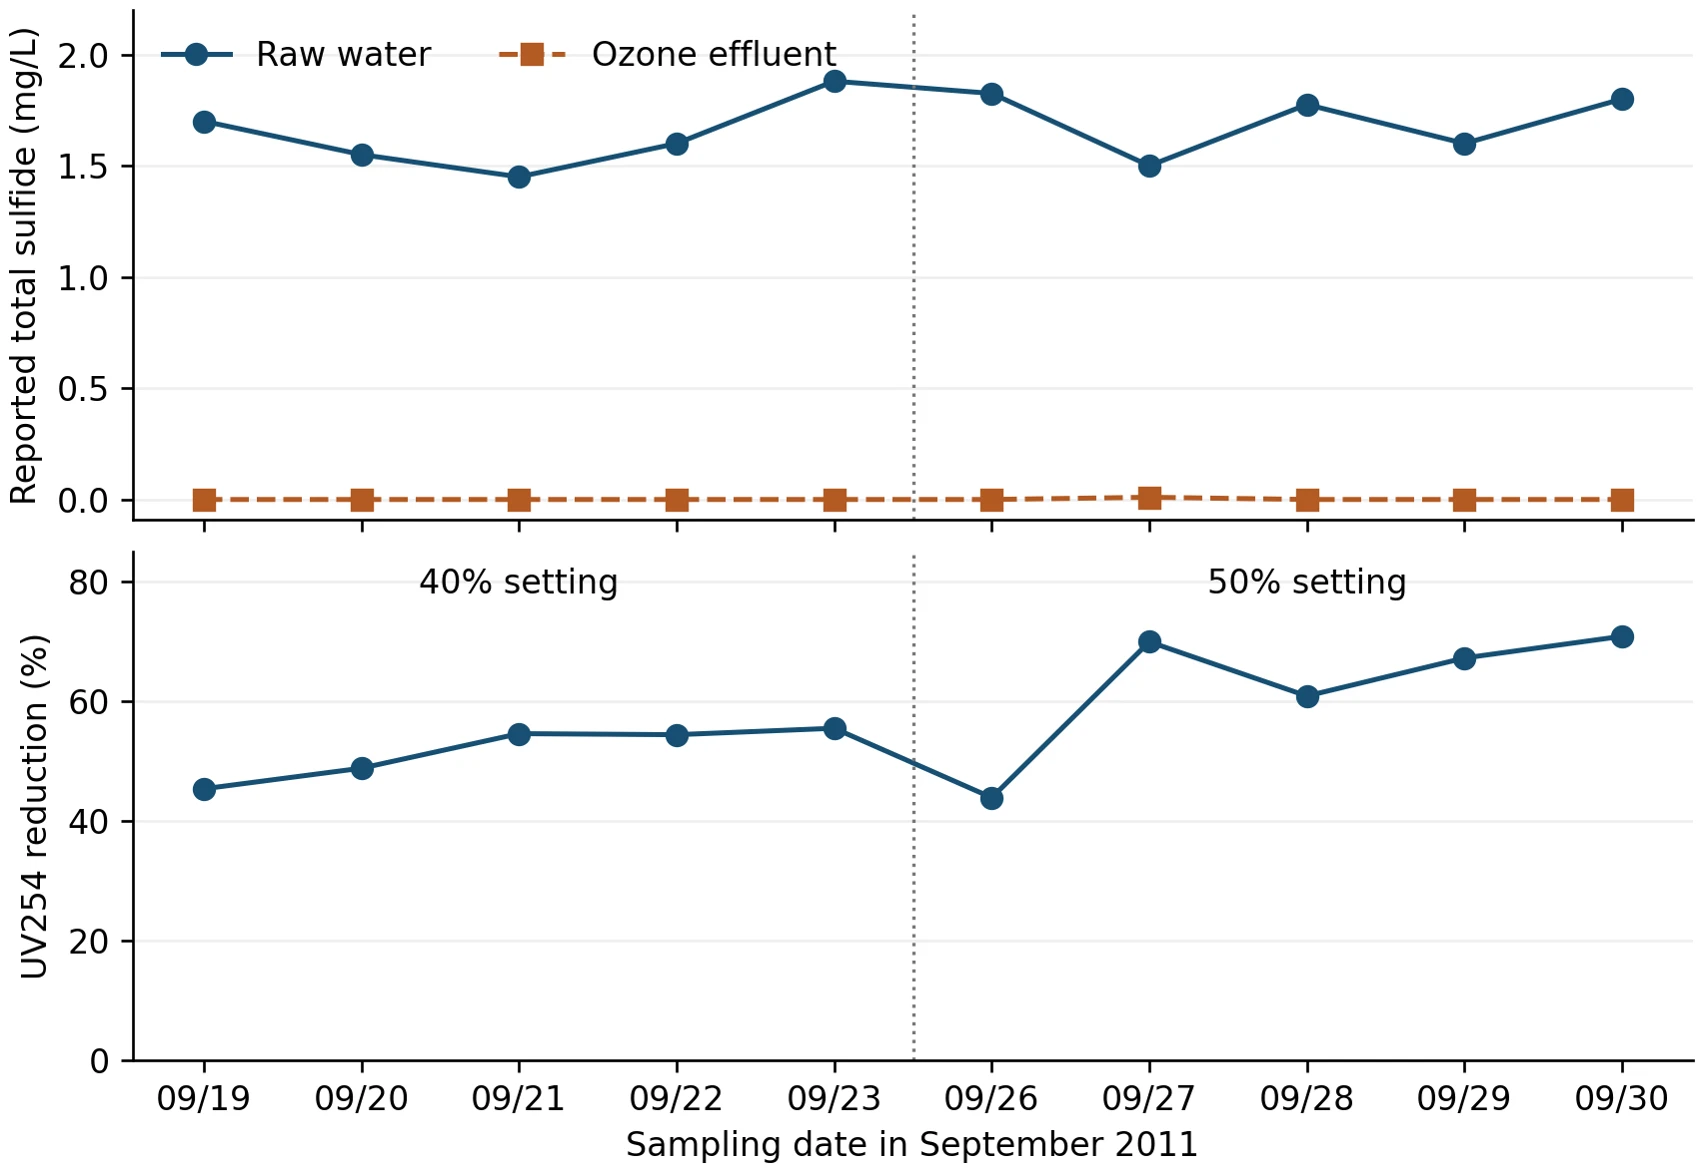
Figure 1. Daily pilot observations during ozone-on operation, September 2011. Upper panel: total sulfide in raw water and ozone effluent. Lower panel: UV254 reduction from raw water to ozone effluent on the same day. The dashed line separates the 40% and 50% generator settings. Source: City of Sanford pilot field logs. [2,3]
Sulfide
Raw-water total sulfide ranged from 1.45 to 1.88 mg/L across the ten ozone-on sampling days. Ozone effluent sulfide was reported as zero on nine days and 0.01 mg/L on one day, and tank samples showed the same pattern. In the October 2011 project review, the team concluded that the 40% setting, which corresponded to an estimated 7.55 mg/L ozone dose, was adequate for sulfide removal. [2,3,5]
Organics
UV254 absorbance fell by 45 to 55% between raw water and ozone effluent at the 40% setting (average 51.7%) and by 44 to 71% at the 50% setting (average 62.5%). These are encouraging indicators of organic oxidation. Because the two settings were tested in successive weeks with naturally varying raw water, the difference between them should be read as a trend rather than a precise dose-response relationship. Fresh GAC also removed most UV254 on its own during the ozone-off baseline, so the full treatment train performance reflects both processes working together.
Residual ozone and protection of the carbon
Dissolved ozone at the first part of the contact basin near the main pipe influent ranged from 0.11 to 0.49 mg/L at the 40% setting and from 0.26 to 0.91 mg/L at 50%. By the time water left the equalization tank, residual ozone was zero on every day with a recorded value. This mattered to the City, which wanted a biofilm to develop in the GAC and was concerned that ozone entering the carbon would inhibit it. At a 60% setting, some residual did reach the carbon, so the team limited further testing to the 40 to 50% range. [5]
Design decisions
The October 2011 project review translated the pilot into four design decisions. First, a preliminary dose of 7 to 8 mg/L would be used for equipment sizing. Second, a decay curve furnished by Pinnacle showed residual falling below 0.5 mg/L within about 4.6 minutes, a level the GAC supplier indicated would have little adverse effect on the carbon. Because roughly five minutes of pipe detention at 5 MGD was impractical, a contact basin was added to the design. Third, the team decided not to claim ozone disinfection credit, relying instead on sodium hypochlorite ahead of storage. Fourth, the City would analyze raw-water bromide and bromate in ozonated and GAC-treated water, and Pinnacle would extend reaction and decay testing to other wells. [5]
That last item is worth emphasizing. Bromate was identified as a question during the pilot phase, but the available pilot records do not include completed bromide or bromate results. As the next section shows, this became the central issue at full scale.
At full scale: the bromate challenge
The full-scale plant, built around a 520 lb/day Pinnacle Zenith 30X™ ozone generator with side-stream injection and Ozone-On-Demand® controls, was commissioned in 2014 and reliably removed sulfide. [13] In December 2015, finished water samples began showing elevated bromate. The City engaged GRDL, which investigated between April and June 2016 through site visits, bench testing on individual wells, kinetic modeling, and a review of plant design and operating data. [6]
Where the bromate was forming
GRDL found the ozone generator and injection equipment functioning properly, with the inlet ozone probe reading within 0.02 mg/L of GRDL calibration equipment. Despite that, water sampled at the inlet probe already contained 13.2 µg/L of bromate. That is between 70 and 84% of the concentrations measured at GAC Filter 3, which shows that most bromate formed in the injection, blending, and early contact zone, upstream of where operators could sample. No sample port was available immediately downstream of the pipeline flash reactor. [6]
Table 1. Selected April 2016 field observations. [6]
| Date and condition | Bromide (µg/L) | Bromate (µg/L) |
|---|---|---|
| April 7: ozone inlet probe | 172.8 | 13.2 |
| April 7: Filter 3 influent | 163.0 | 19.0 |
| April 7: Filter 3 effluent | 171.5 | 15.7 |
| April 20: valve open, 0.075 mg/L setpoint | 138.3 | 7.6 |
| April 20: valve open, 0.300 mg/L setpoint | 132.8 | 11.8 |
| April 20: valve closed, 0.300 mg/L setpoint | 133.7 | 13.1 |
The April 20 tests point to the most practical operating lever. Reducing the inlet probe setpoint from 0.300 to 0.075 mg/L coincided with bromate falling from 11.8 to 7.6 µg/L, below the 10 µg/L limit. GRDL noted that any measurable residual at the inlet probe means no sulfide is reaching the carbon. In other words, the plant was carrying more residual than sulfide removal required. GRDL recommended a setpoint range of 0.040 to 0.060 mg/L for further evaluation. [6]
Why the bench tests disagreed with the plant
Early bench tests on samples from Wells 7, 8, 9, and 12 produced only 0.2 to 3.9 µg/L of bromate, far below field results. The explanation turned out to be the samples themselves: sulfide had been lost during transport and storage, which sharply reduced their ozone demand. Doses were then adjusted to hit a target residual, so the bench water never experienced the same chemistry or ozone history as water at the plant. [6]
Table 2. Selected bench conditions on stored samples that had lost sulfide. [6]
| Source | Bromide (µg/L) | Ozone dose (mg/L) | pH | Bromate (µg/L) |
|---|---|---|---|---|
| Wells 9 and 12 | 168.9 | 1.52 | 7.49 | 0.2 |
| Well 7 | 192.3 | 1.64 | 7.40 | 2.0 |
| Well 8 | 234.9 | 3.71 | 7.47 | 3.9 |
The lesson for any project is direct. Sulfide-bearing water changes quickly once it leaves the well. Bench or pilot results from samples that have lost sulfide will understate ozone demand and can understate bromate risk. Testing should include spiking samples with H2S to levels within the historical concentration range for the specific well.
Restoring real-world demand
GRDL addressed this in a June 2016 addendum. Well 7 water was spiked with sulfide to approximate its measured wellhead concentration of 1.80 mg/L, then dosed with gaseous ozone while gas flow and concentration were integrated to calculate transferred dose. Dissolved ozone was measured every 30 seconds after the ozone gas injection was halted. [6]
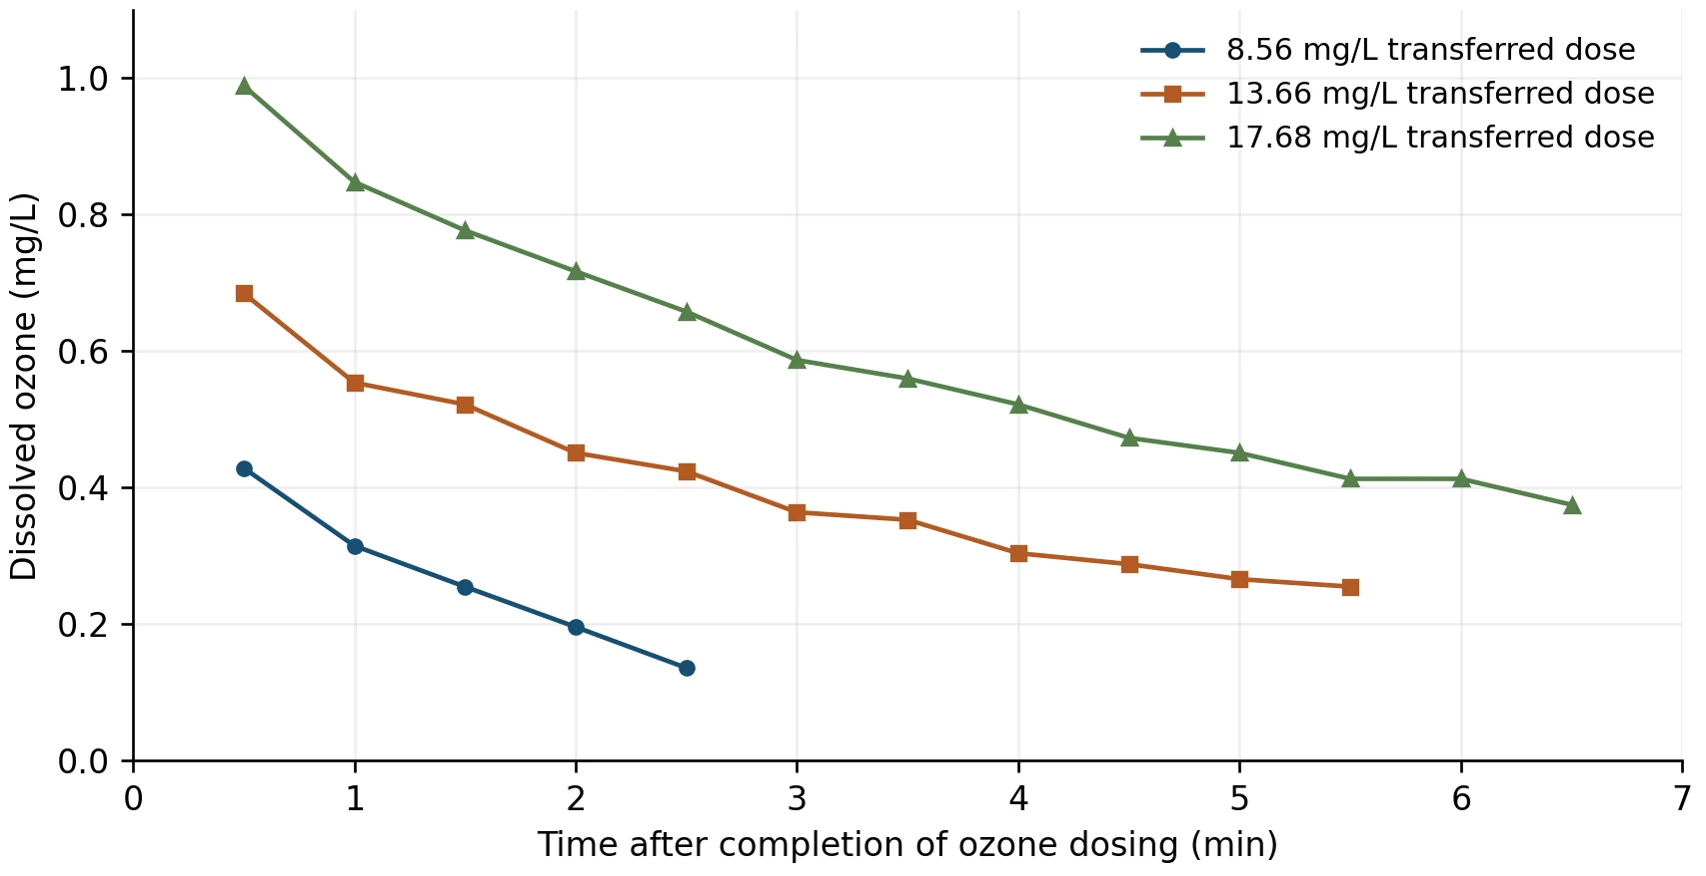
Figure 2. Dissolved ozone decay after three transferred doses in sulfide-spiked Well 7 water, June 2016. Reconstructed from data embedded in the GRDL report. Time zero is the end of ozone gas dosing. [6]
Table 3. June 2016 sulfide-spiked test results. [6]
| Transferred dose (mg/L) | Initial H2S (mg/L) | O3 at 0.5 min (mg/L) | Dose minus residual (mg/L) | Final H2S (mg/L) |
|---|---|---|---|---|
| 8.56 | 1.66 | 0.429 | 8.13 | 0 |
| 13.66 | 1.93 | 0.685 | 12.98 | 0 |
| 17.68 | 1.83 | 0.989 | 16.69 | 0 |
At 8.56 mg/L, the residual was 0.315 mg/L one minute after dosing. That agrees well with the plant’s reported operation, in which doses of about 8 to 9 mg/L produced a residual near 0.3 mg/L. It is also consistent with the 7 to 8 mg/L design basis set in 2011. Nearly all of the transferred ozone was consumed almost immediately, and sulfide was eliminated at every dose tested. These tests did not include bromate measurements. A future program should measure bromate under these sulfide-restored conditions to define the sulfide-bromate trade-off directly.
Designing for the flow the plant actually runs
The ozone contact basin was designed for a hydraulic retention time of 7.42 minutes at 4.6 MGD. In 2016, the plant routinely ran between 2.2 and 3.2 MGD, or about 50 to 70% of design flow. With fixed basin volume, lower flow means longer nominal contact time and lower velocity through the contact basin. [6]
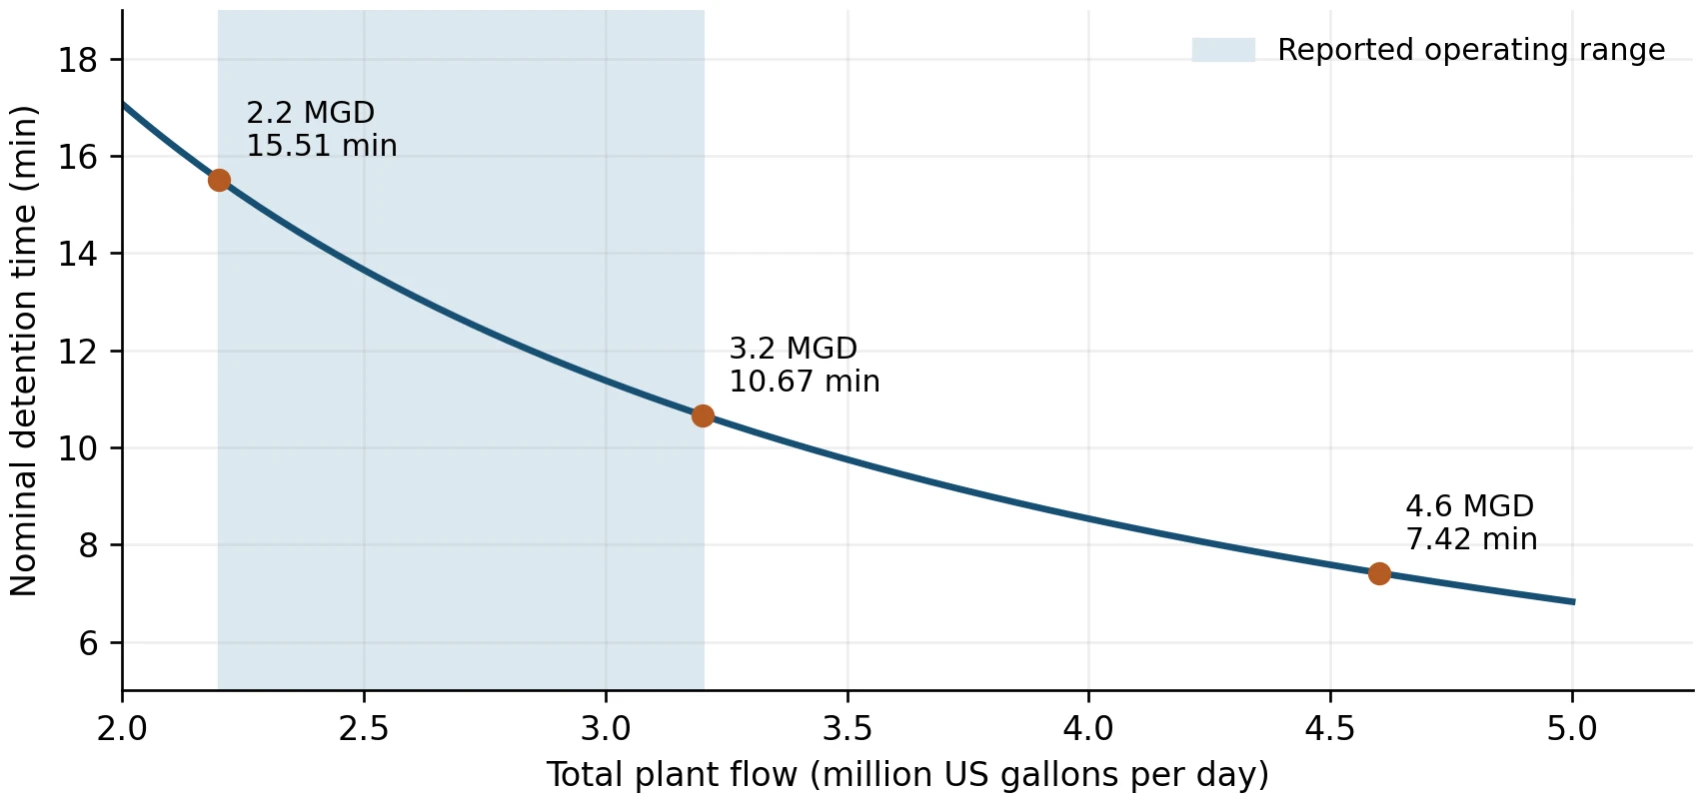
Figure 3. Nominal detention time versus plant flow, calculated from the 7.42-minute design point at 4.6 MGD. The shaded band is the reported 2.2–3.2 MGD operating range. Assumes constant active volume. [6]
Table 4. Flow-dependent ratios relative to design flow.
| Flow (MGD) | Nominal detention (min) | Detention ratio | Velocity ratio | Velocity² ratio |
|---|---|---|---|---|
| 4.6 (design) | 7.42 | 1.00 | 1.00 | 1.00 |
| 3.2 | 10.67 | 1.44 | 0.70 | 0.48 |
| 2.2 | 15.51 | 2.09 | 0.48 | 0.23 |
At the low end of the operating range, water spends roughly twice as long in contact with ozone as the design assumed. If ozone persists, that extra time adds exposure and therefore bromate. At the same time, mean velocity drops by about half, which GRDL identified as reducing mixing energy in the basin. Poorer mixing can leave zones of locally high ozone concentration even when the average residual looks acceptable. GRDL estimated that the basin was operating at 1.5 to 2 times the required CT. It recommended investigating added mixing (baffle curtains, submersible mixers, or pumps in the early contact zone) and relocating or supplementing the dissolved ozone probes, including evaluation of oxidation-reduction potential (ORP) probes for process control. [6,11]
Velocity squared is a useful indicator, but it is not a direct measure of mixing performance. Confirming actual mixing requires tracer testing and concentration profiling across the basin. The broader point stands, however: many plants spend years operating well below design flow, and ozone systems should be designed and verified for that reality.
Lessons for utilities and design engineers
Lesson 1: Pilot with representative water and measure bromate from the start
Sanford’s pilot answered the sulfide question convincingly and bromate was flagged as a follow-up item. On bromide-bearing sources, bromide and bromate should be part of the core pilot sampling plan alongside sulfide, UV254, and residual ozone. The source water used for the bench ozonation tests should be tested for residual sulfide and if necessary spiked with a hydrogen sulfide reagent in order to mimic the dissolved H2S level in that well’s historical water quality data. Bromate formation should be analyzed in the same tests.
Lesson 2: Define dose precisely
Applied dose (ozone production rate per water flow rate), transferred dose (the actual ozone dose based on the % mass transfer efficiency), dissolved residual (ozone concentration at a specific time and place), and ozone exposure (residual integrated over time) are different quantities. Generator percentage settings are not doses. Design criteria, control setpoints, and performance claims should each state which quantity they refer to. That avoids confusion when pilot, bench, model, and plant data are compared.
Lesson 3: Treat the injection and blending zone as part of the reactor
At Sanford, most bromate had formed before the first monitored point. Designs should provide sample access immediately downstream of injection and blending, consider how sidestream contact time and blending affect early exposure, and locate control instruments where they reflect the conditions that drive by-product formation. Research on ozone dissolution systems supports this focus on the earliest part of the process. [11]
Lesson 4: Design and verify across the full flow range
Contact time and mixing both change with flow. Designers should evaluate performance at minimum and typical operating flows as well as design flow, provide mixing that remains effective at turndown, and consider how dose and residual control will adapt as flow changes. A tracer test at commissioning provides a baseline for later troubleshooting.
Lesson 5: Choose the right dissolved ozone sensor and sample location to precisely control ozone dose and minimize bromate formation
It is vital to assess the optimum combination of the ozone dose control sensor and its placement in the post ozonated process stream. The sensor probe sensitivity, response time and HRT from the point of ozone injection are critical for the precise control of the ozone dose, dissolved ozone residual and minimizing the level of bromate formation.
Lesson 6: Control bromate at the source, and use GAC as a backstop
GRDL concluded that the plant’s carbon filters likely reduced bromate during their early operation and that this capacity was being exhausted. Research shows GAC bromate removal declines as new carbon transitions to biologically active carbon. [12] Durable bromate control comes from the ozone process itself: the lowest residual setpoint that still assures sulfide removal, pH adjustment where appropriate (GRDL’s model suggested a 0.3-unit pH reduction could lower bromate by about 5.5 µg/L, to be balanced against corrosion control), effective mixing, and well-placed monitoring. [6,8]
A practical project checklist
The following checklist summarizes how these lessons translate into project steps for a new ozone system or an optimization of an existing one.
| Phase | Key actions |
|---|---|
| Source characterization | Sample every well and expected blend for sulfide, bromide, pH, temperature, alkalinity, and TOC/DOC. Capture seasonal and well-rotation variability. |
| Bench and pilot testing | Once the well sample water arrives at the lab for benchtop testing, verify the H2S residual and spike the sample with a sulfide reagent accordingly. Measure sulfide, bromate, ozone residual decay, and UV254 together across a range of transferred doses. |
| Design | State the dose basis. Provide sample ports right after injection and blending. Size mixing and control for minimum, typical, and design flows. Choose the appropriate dissolved ozone control probe type and carefully plan the location of the probe for optimum response time. |
| Commissioning | Run tracer tests. Profile dissolved ozone and bromate through the process. Set the lowest residual that reliably achieves the sulfide endpoint. |
| Operation | Trend bromate by location, residual setpoint, flow, and well blend. Track GAC loading and age. Revisit setpoints when flow or sources change. |
Conclusion
The Sanford record confirms that ozone is a highly effective treatment for sulfide-bearing groundwater. Across the pilot and the later sulfide-restored tests, ozone reduced sulfide to zero or near zero at every condition evaluated, and 2016 testing was consistent with the 7 to 8 mg/L design basis established in 2011. The same record shows that sulfide removal and bromate control are a single design problem, not two separate ones. Where bromide is present, the right outcome depends on how ozone exposure is distributed in the earliest part of the process and how the plant behaves across its actual flow range.
Utilities and engineers who plan for both from the start (representative testing, precise dose definitions, early-zone monitoring, turndown-ready mixing, and conservative residual control) can capture the full benefits of ozone while staying comfortably within bromate limits.
About Pinnacle Ozone Solutions
Headquartered in Cocoa, Florida, Pinnacle Ozone Solutions designs, manufactures, and supports modular, energy-efficient ozone generation systems for municipal, industrial, and aquaculture applications, with all design, manufacturing, and support based in the United States. Its product line includes the Apex, Zenith, Summit, and Peak generator platforms built on QuadBlock® technology, along with injection skids, destruct units, and complete integrated systems. Pinnacle’s in-house Research & Development Laboratory provides ozone demand, decay, and bromate testing to support pilot studies and system design, and PinnacleCare service plans support systems throughout their operating life.
Pinnacle Ozone Solutions, LLC • 3001 Oxbow Circle, Cocoa, FL 32926 • pinnacleozone.com
Acknowledgments
Pilot operation and field data collection were performed by City of Sanford utility staff. Preliminary design and the October 2011 project review were led by CPH Engineers with Reiss Engineering. The 2016 process optimization investigation wa performed by Guardian Manufacturing Research and Development Laboratory, with Thoram Charanda as report author.
References
- City of Sanford. Pilot Field Daily, Week 1 (September 14–16, 2011). Unpublished field workbook.
- City of Sanford. Pilot Field Daily, Week 2 (September 19–23, 2011). Unpublished field workbook.
- City of Sanford. Pilot Field Daily, Week 3 (September 26–30, 2011). Unpublished field workbook.
- Ozone/GAC pilot study process schematic and sampling plan. Undated; reviewed with the 2011 pilot records.
- CPH Engineers. Meeting Memorandum: City of Sanford Aux. WTP 2 DBP Improvements, Meeting at Pinnacle Offices. October 12, 2011. CPH Job No. S06118.
- Charanda T, Guardian Manufacturing Research and Development Laboratory. Sanford, FL WTP #2 Ozone Process Optimization Report, May 18, 2016, with June 2016 addendum.
- von Gunten U, Hoigné J. Bromate formation during ozonization of bromide-containing waters: Interaction of ozone and hydroxyl radical reactions. Environmental Science & Technology. 1994;28(7):1234–1242. https://doi.org/10.1021/es00056a009
- Pinkernell U, von Gunten U. Bromate minimization during ozonation: Mechanistic considerations. Environmental Science & Technology. 2001;35(12):2525–2531. https://doi.org/10.1021/es001502f
- US Environmental Protection Agency. National Primary Drinking Water Regulations: bromate MCL 0.010 mg/L. https://www.epa.gov/ground-water-and-drinking-water/national-primary-drinking-water-regulations
- Siddiqui MS, Amy GL, Murphy BD. Ozone enhanced removal of natural organic matter from drinking water sources. Water Research. 1997;31(12):3098–3106. https://doi.org/10.1016/S0043-1354(97)00130-9
- Wert EC, Lew J, Rakness KL. Effect of ozone dissolution systems on ozone exposure and bromate formation. Journal AWWA. 2017;109(7):E302–E312. https://doi.org/10.5942/jawwa.2017.109.0048
- Asami M, Aizawa T, Morioka T, Nishijima W, Tabata A, Magara Y. Bromate removal during transition from new granular activated carbon (GAC) to biological activated carbon (BAC). Water Research. 1999;33(12):2797–2804. https://doi.org/10.1016/S0043-1354(98)00504-1
- Pinnacle Ozone Solutions. Case Study: Sanford, FL Upgrades Water Treatment with Pinnacle Zenith 30X Ozone Generator. August 10, 2024. https://pinnacleozone.com/resources/case-studies/
Appendix A: Pilot data
Table A1. Daily values used in Figure 1. Sulfide in mg/L as recorded; UV254 as recorded in worksheets. ΔUV is the calculated reduction from raw water to ozone effluent. [2,3]
| Date (2011) | Setting | Sulfide raw | Sulfide out | UV254 raw | UV254 out | ΔUV (%) |
|---|---|---|---|---|---|---|
| Sep 19 | 40% | 1.700 | 0.00 | 0.086 | 0.047 | 45.3 |
| Sep 20 | 40% | 1.550 | 0.00 | 0.082 | 0.042 | 48.8 |
| Sep 21 | 40% | 1.450 | 0.00 | 0.099 | 0.045 | 54.5 |
| Sep 22 | 40% | 1.600 | 0.00 | 0.103 | 0.047 | 54.4 |
| Sep 23 | 40% | 1.880 | 0.00 | 0.101 | 0.045 | 55.4 |
| Sep 26 | 50% | 1.825 | 0.00 | 0.098 | 0.055 | 43.9 |
| Sep 27 | 50% | 1.500 | 0.01 | 0.073 | 0.022 | 69.9 |
| Sep 28 | 50% | 1.775 | 0.00 | 0.097 | 0.038 | 60.8 |
| Sep 29 | 50% | 1.600 | 0.00 | 0.067 | 0.022 | 67.2 |
| Sep 30 | 50% | 1.800 | 0.00 | 0.089 | 0.026 | 70.8 |
Calculations: UV254 reduction (%) = 100 × (1 − ozone effluent / raw). Nominal detention time (min) = 7.42 × 4.6 / Q, with Q in MGD. Relative velocity = Q / 4.6 for a fixed cross-section. Generator percentages are equipment settings; the corresponding dose estimates (7.55 mg/L at 40%, 8.01 mg/L at 50%, 8.82 mg/L at 60%) are taken from the October 2011 memorandum. [5]
